Skip to content

Next Data Lab

Let's Analyse the Data

Category

Statistics

Measuring the Spread of Your Data: A Friendly Guide to Standard Deviation

By ABSJanuary 25, 2022March 30, 2025

Ever wondered how to measure the chaos in your data? Enter standard deviation—the gold standard for gauging variability. Combine it with the mean (check my guide to calculating the mean), and you’ve got a dynamic duo to decode any dataset. Whether you’re a Stats 101 student tackling your first problem set or a master’s grad …

Continue Reading
Tags: statistics

Understanding the Measure of Central Tendency: A Friendly Guide to Calculating the Mean

By ABSJanuary 20, 2022March 30, 2025
Understanding the Measure of Central Tendency: A Friendly Guide to Calculating the Mean

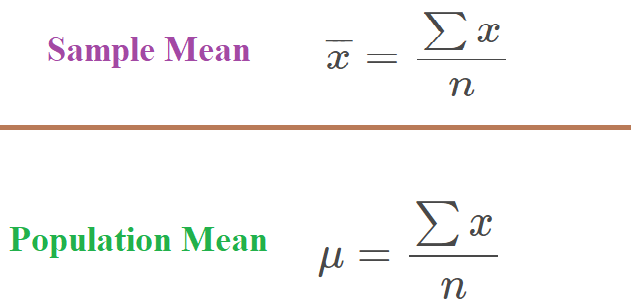
Statistics can feel like a maze sometimes, but the mean? That’s your trusty compass. It’s just the average of a data set—a simple way to find the central point of your numbers. I’ve always found it handy, whether I’m summarizing data as a data scientist or figuring out my monthly coffee spending (which, trust me, …

Continue Reading
Tags: statistics

Residual in Regression Analysis

By ABSJanuary 20, 2022April 4, 2022
Residual in Regression Analysis

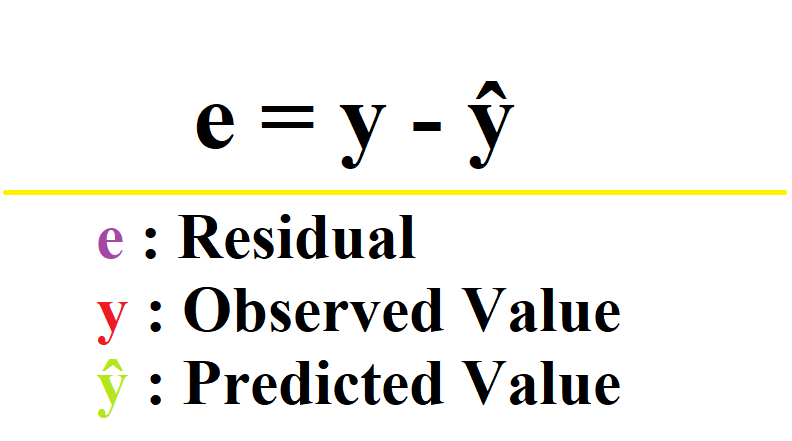
Residual is the vertical distance between the observed actual value (dependent variable) and the predicted value (generated by regression equation). Formula to calculate Residual e = y – ŷ Here,e = Residualy = Observed Actual valueŷ = Predicted value 1) Observed Value (y) higher than the Predicted value (ŷ) – Positive Residual 2) Predicted value …

Continue Reading
Tags: residual statistics
Theme: Sublime Blog by SublimeTheme. Proudly powered by WordPress